We’ve been in the HVAC business for 26 years in the Hudson Valley, and we’ve observed major shifts in how people heat their homes. Today, thanks to data from the US Census Bureau, we can confirm that these shifts aren’t just anecdotal; they’re backed up by data.
Over the latest available ten years from 2013 to 2023, the following shifts in heating methods have happened thanks to homeowners in Greene County, New York:
1. The use of natural gas boomed from 1,089 households to 1,718 households, an increase of about 57.8%
One of the most striking trends has been the increase in natural gas in Greene County as a whole, which can be largely attributed to homeowners converting away from fuel oil and woodburning for their heat.
Once a fuel oil burning furnace is over 15 years old, there can be great efficiencies to be found in converting your furnace to natural gas.
2. Fuel oil and kerosene have fallen from 10,816 households to 8,818, a drop of about 18%
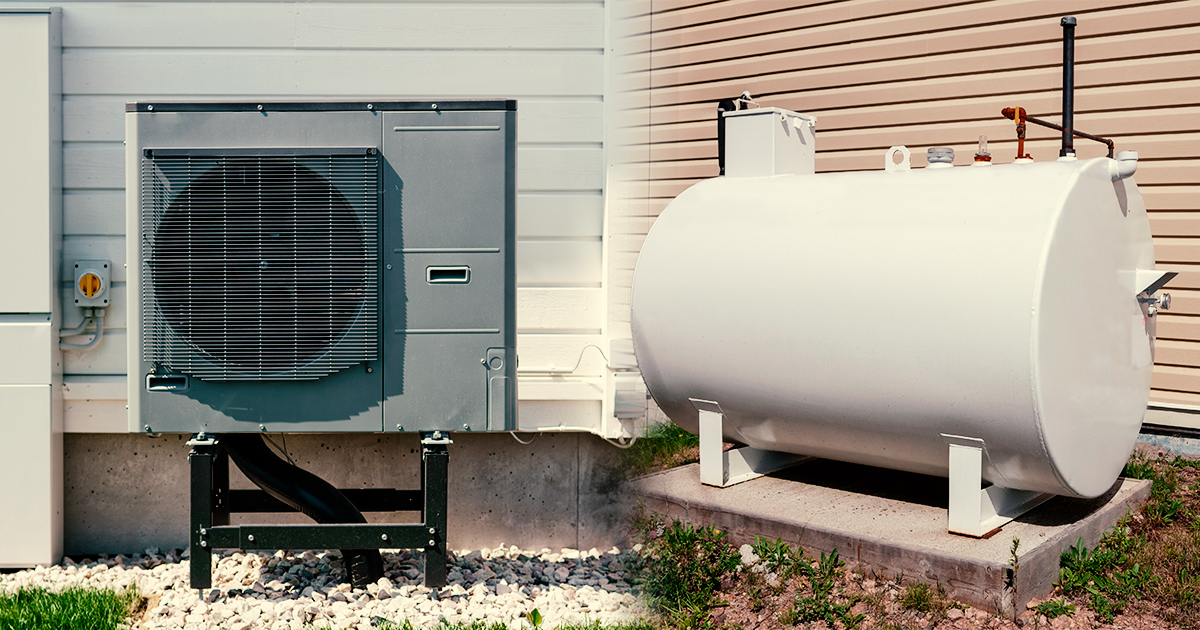
The second most striking trend has been the migration of homeowners away from fuel oil and kerosene. About half of fuel oil customers have moved onto propane, which burns a little cleaner and can still be stored at your home. Another quarter converted to natural gas, which doesn’t require having a storage tank at your house and the incentives can help pay for new appliances. And the other quarter moved on to electric heat, which includes ductless mini-splits or heat pumps.
3. Mini Splits and Heat Pump Adoption Has Increased by 25%
The third big picture insight has been that the adoption of heat pumps and ductless mini-splits has likely driven an increase in electric heat households in Greene County. Only about a sixth of Greene County’s households rely on electric heating, with the majority relying on methods like fuel oil and propane where fuel can be stored at their home. But the gap is narrowing slowly.
Greene County Heating Trend from 2013 to 2023
| Fuel Type | 2013 | 2023 | Change | % Change |
|---|---|---|---|---|
| Utility Gas | 1,089 | 1,718 | ▲ 629 | +57.8% |
| Bottled/LP Gas | 1,932 | 3,092 | ▲ 1,160 | +60.0% |
| Electricity | 2,267 | 2,827 | ▲ 560 | +24.7% |
| Fuel oil/kerosene | 10,816 | 8,818 | ▼ -1,998 | -18.5% |
| Coal or Coke | 59 | 0 | ▼ -59 | -100.0% |
| Wood | 2,011 | 1,216 | ▼ -795 | -39.5% |
| Solar Energy | 22 | 10 | ▼ -12 | -54.5% |
| Other Fuel | 169 | 478 | ▲ 309 | +182.8% |
| No Fuel Used | 0 | 29 | ▲ 29 | — |
Catskill, NY Heating Breakdown
| Fuel Type | 2013 | 2023 | Change |
|---|---|---|---|
| Utility Gas | 612 | 1,093 | ▲ 481 |
| Bottled/LP Gas | 429 | 725 | ▲ 296 |
| Electricity | 356 | 584 | ▲ 228 |
| Fuel Oil | 2,418 | 2,080 | ▼ 338 |
| Coal | 35 | 0 | ▼ 35 |
| Wood | 409 | 113 | ▼ 296 |
| Solar | 15 | 0 | ▼ 15 |
| Other Fuel | 31 | 59 | ▲ 28 |
| No Fuel Used | 0 | 0 | — |
Heating for Catskill, NY households experienced a number of trends. While fuel oil is still dominant, a percentage of homeowners are moving away from it, as well as wood-burning, and toward natural gas, mini-splits or heat pumps, and some propane.
Coxsackie, NY Heating Breakdown
| Fuel Type | 2013 | 2023 | Change |
|---|---|---|---|
| Utility Gas | 200 | 346 | ▲ 146 |
| Bottled/LP Gas | 272 | 436 | ▲ 164 |
| Electricity | 312 | 478 | ▲ 166 |
| Fuel Oil | 1,518 | 1,015 | ▼ 503 |
| Coal | 24 | 0 | ▼ 24 |
| Wood | 134 | 99 | ▼ 35 |
| Solar | 0 | 0 | — |
| Other Fuel | 38 | 80 | ▲ 42 |
| No Fuel Used | 0 | 17 | ▲ 17 |
For heating in Coxsackie, NY, again there is a trend away from fuel oil and toward equal parts natural gas, propane, and mini-splits or heat pumps.
Hunter, NY Heating Breakdown
| Fuel Type | 2013 | 2023 | Change |
|---|---|---|---|
| Utility Gas | 15 | 45 | ▲ 30 |
| Bottled/LP Gas | 116 | 165 | ▲ 49 |
| Electricity | 329 | 170 | ▼ 159 |
| Fuel Oil | 515 | 422 | ▼ 93 |
| Coal | 0 | 0 | — |
| Wood | 131 | 45 | ▼ 86 |
| Solar | 0 | 3 | ▲ 3 |
| Other Fuel | 4 | 18 | ▲ 14 |
| No Fuel Used | 0 | 0 | — |
For heating in Hunter, NY, homeowners are moving away what appears to be an abundance of baseboard heating and fuel oil and toward natural gas and propane. According to the US Census, the total number of registered households also has dropped, hinting at a number of Airbnbs that might not be accounted for in these statistics.
Windham, NY Heating Breakdown
| Fuel Type | 2013 | 2023 | Change |
|---|---|---|---|
| Utility Gas | 6 | 11 | ▲ 5 |
| Bottled/LP Gas | 66 | 79 | ▲ 13 |
| Electricity | 156 | 227 | ▲ 71 |
| Fuel Oil | 328 | 274 | ▼ 54 |
| Coal or Coke | 0 | 0 | — |
| Wood | 83 | 47 | ▼ 36 |
| Solar Energy | 0 | 0 | — |
| Other Fuel | 4 | 0 | ▼ 4 |
| No Fuel Used | 0 | 6 | ▲ 6 |
In Windham, it doesn’t look like there’s much natural gas available for homeowners. So when people move off of wood-burning or fuel oil, they’re mostly choosing ductless-mini splits or heat pumps, and some propane.
Are you a Greene County homeowner looking into your heating options? Give us a call at 845-399-0669. For 26 years, we’ve been a trusted local partner for fair, effective and efficient heating and cooling systems in the Hudson Valley.